
SpecterInsight supports unique integrations with ElasticSearch, Logstash, and Kibana (ELK) out-of-the-box. Command output from your deployed Specters comes back as objects with properties that are then augmented and shipped off to ElasticSearch. This means that you can search your command history in Kibana on specific fields.
Example
This concept is probably easier to convey with a concrete example. If you fire up SpecterInsight, interact with one of the Specters that is beaconing back, and issue the script shown below, the Specter will pick up and execute that script during the next checkin. The output of the script will then be serialized back to the C2 server as an object.
load recon;

Get-LocalUsers
The script shown above loads the recon module and then executes the Get-LocalUsers cmdlet to pull information about users on the local system. The command itself returns a collection of objects with several fields including Username, Enabled, PwdLastSet, and LastLogon. Once the C2 server receives the output of the command, SpecterInsight will then add additional metadata to each of the objects returned from the command. The table below shows the difference between the original and augmented objects.
[
  {
    "ComputerName": "localhost",
    "UserName": "helpdesk",
    "Enabled": true,
    "Rid": 1001,
    "UserType": "Administrator",
    "Comment": "",
    "PwdLastSet": "2021-12-30T23:59:35.1694269-08:00",
    "LastLogon": "2023-05-09T19:28:45-07:00",
    "NumLogins": 4195
  }
][
{
"Session": {
"MachineId": "dfec7175a6a62757d83b93794df767d5acfadb82",
"SessionId": "acc45c58a4ac45008b6964814aba39cb",
"FQDN": "DESKTOP-LMCH70V",
"IP": "::1",
"OS": "Windows 10.0.19044",
"Username": "DESKTOP-LMCH70V\\helpdesk",
"PID": 22484,
"Path": "C:\\Users\\helpdesk\\Desktop\\Workspace\\repos\\SpecterInsight\\src\\Release\\implants\\cfdab361ab8f4b659b269bfe8f7b9b55\\x64\\WinNativeExe.exe"
},
"@timestamp": "2023-05-14T06:59:07.9808626Z",
"Specter": {
"TaskId": "1c8bbc6845ad4ffcb16cc0a5da075b7d",
"Command": "load recon;\\r\\nGet-LocalUsers",
"Type": "Task",
"Category": "",
"Subcategory": ""
},
"ComputerName": "localhost",
"UserName": "helpdesk",
"Enabled": true,
"Rid": 1001,
"UserType": "Administrator",
"Comment": "",
"PwdLastSet": "2021-12-30T23:59:35.150739-08:00",
"LastLogon": "2023-05-13T22:36:38-07:00",
"NumLogins": 4226
}
]Configuration
The SpecterInsight UI allows users to manage configuration settings on-the-fly using the SpecterInsight settings page. The Elastic service will update itself upon any configuration changes being saved, so no restart is required once the Elastic options are updated.
Connection. At a minimum, you must set the Elastic.Uri setting. By default, SpecterInsight will verify the SSL/TLS certificate using the local certificate store. To disable certificate verification set Elastic.ValidateServerCertificate to false.
Authentication. If you require authentication, SpecterInsight currently supports Username/Password authentication with the Elastic.Username and Elastic.Password options.
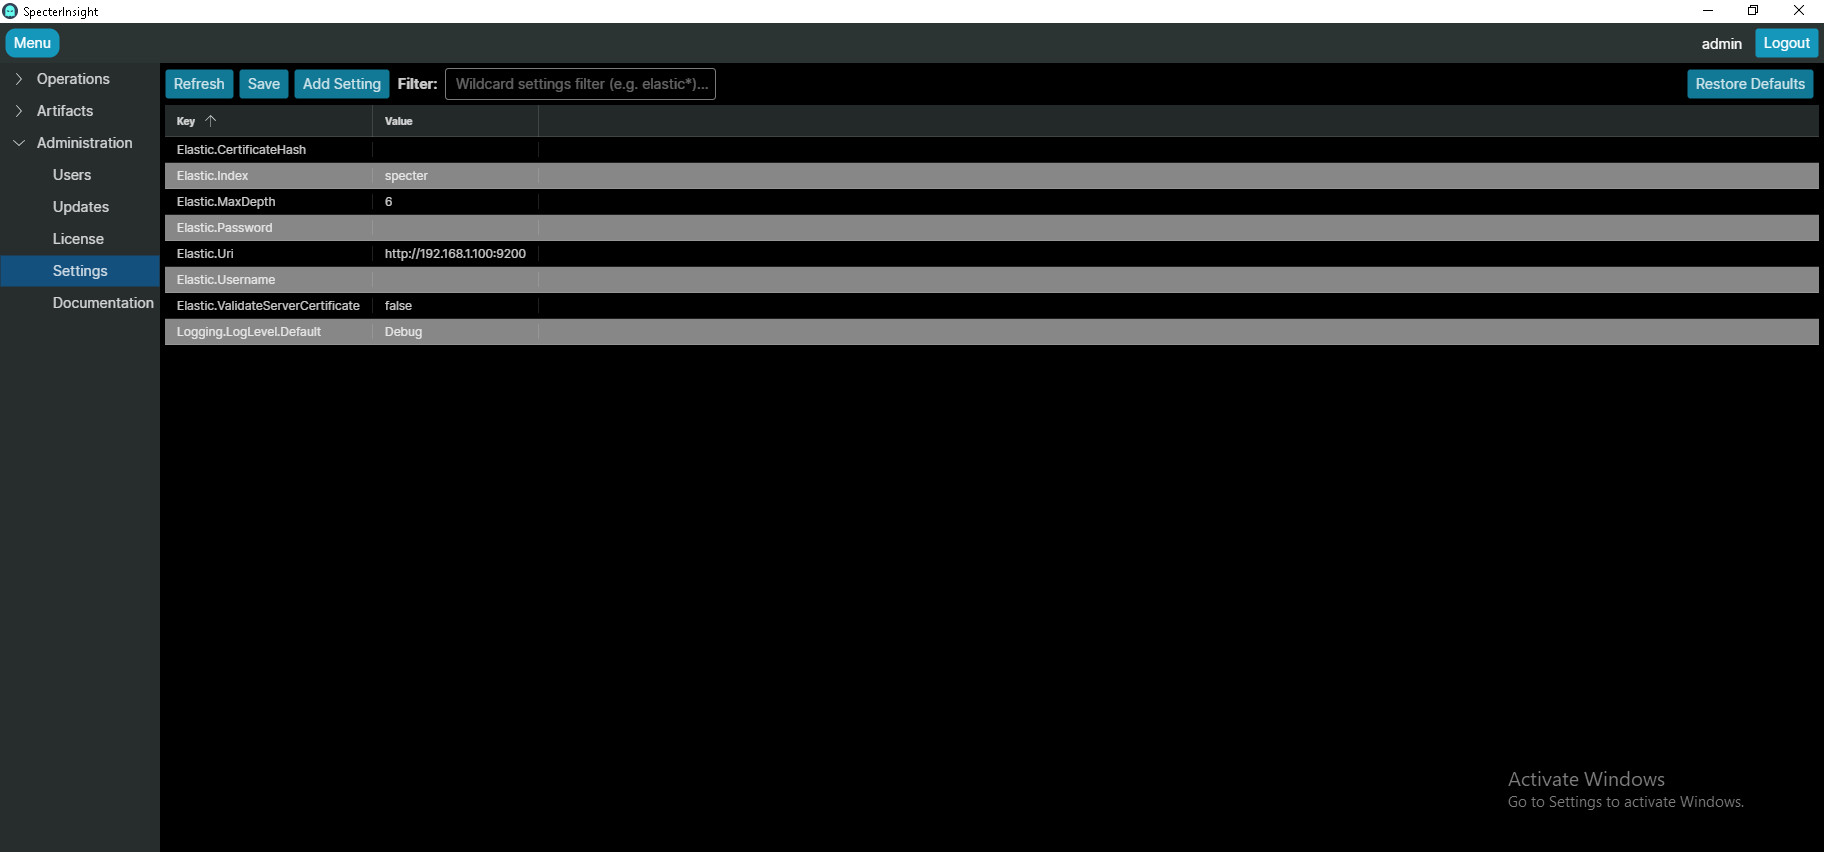
Settings
The table below summarizes all of the settings available for ELK integration.
| Setting | Example | Description |
|---|---|---|
| Elastic.Index | specter | The name of the index to store the data in Elasticsearch. |
| Elastic.MaxDepth | 6 | How deep into an object will properties be serialized. After 6 nested objects, the serializer will give up. This helps ensure that highly nested objects do not destabilize the SpecterInsight server. |
| Elastic.Username | elastic | The username to use for authentication. |
| Elastic.Password | changeme | The password to use for authentication. |
| Elastic.Uri | http://192.168.1.100:9200 | The URI for the Elasticsearch server. By default Elasticsearch listens on port 9200. |
| Elastic:ValidateServerCertificate | false | Whether or not the SSL/TLS certificate used by the Elasticsearch server should be validated by SpecterInsight. Disabling certificate validation could allow for man-in-the-middle attacks without warning or notification. |
| Elastic:CertificateHash | 58FD671E2D4D200CE92D6E799EC70DF96E6D2664 | The SHA1 has of the certificate as a hexadecimal string. This value can be used as one way to validate the SSL/TLS certificate. If ValidateServerCertificate is true and CertificateHash is not defined, then the certificate store will be used to validate the certificate. |
Dashboards
SpecterInsight ships with pre-built dashboards for analyzing data collected from interactive operations.
Importing the Dashboards
Unfortunately, SpecterInsight is not currently able to import dashboards through the API, so this step will need to be done manually.
- In Kibana, click on the hamburger menu.
- Navigate to Stack Management → Saved Objects.
- Click on the “Import” link.
- Navigate to your SpecterInsight server directory root.
- Navigate to ./elastic/.
- Select “dashboards.ndjson”.
- Click the “Import” button.
- This will load all of the pre-built dashboards and configure a default data view that is referenced by the visualizations.

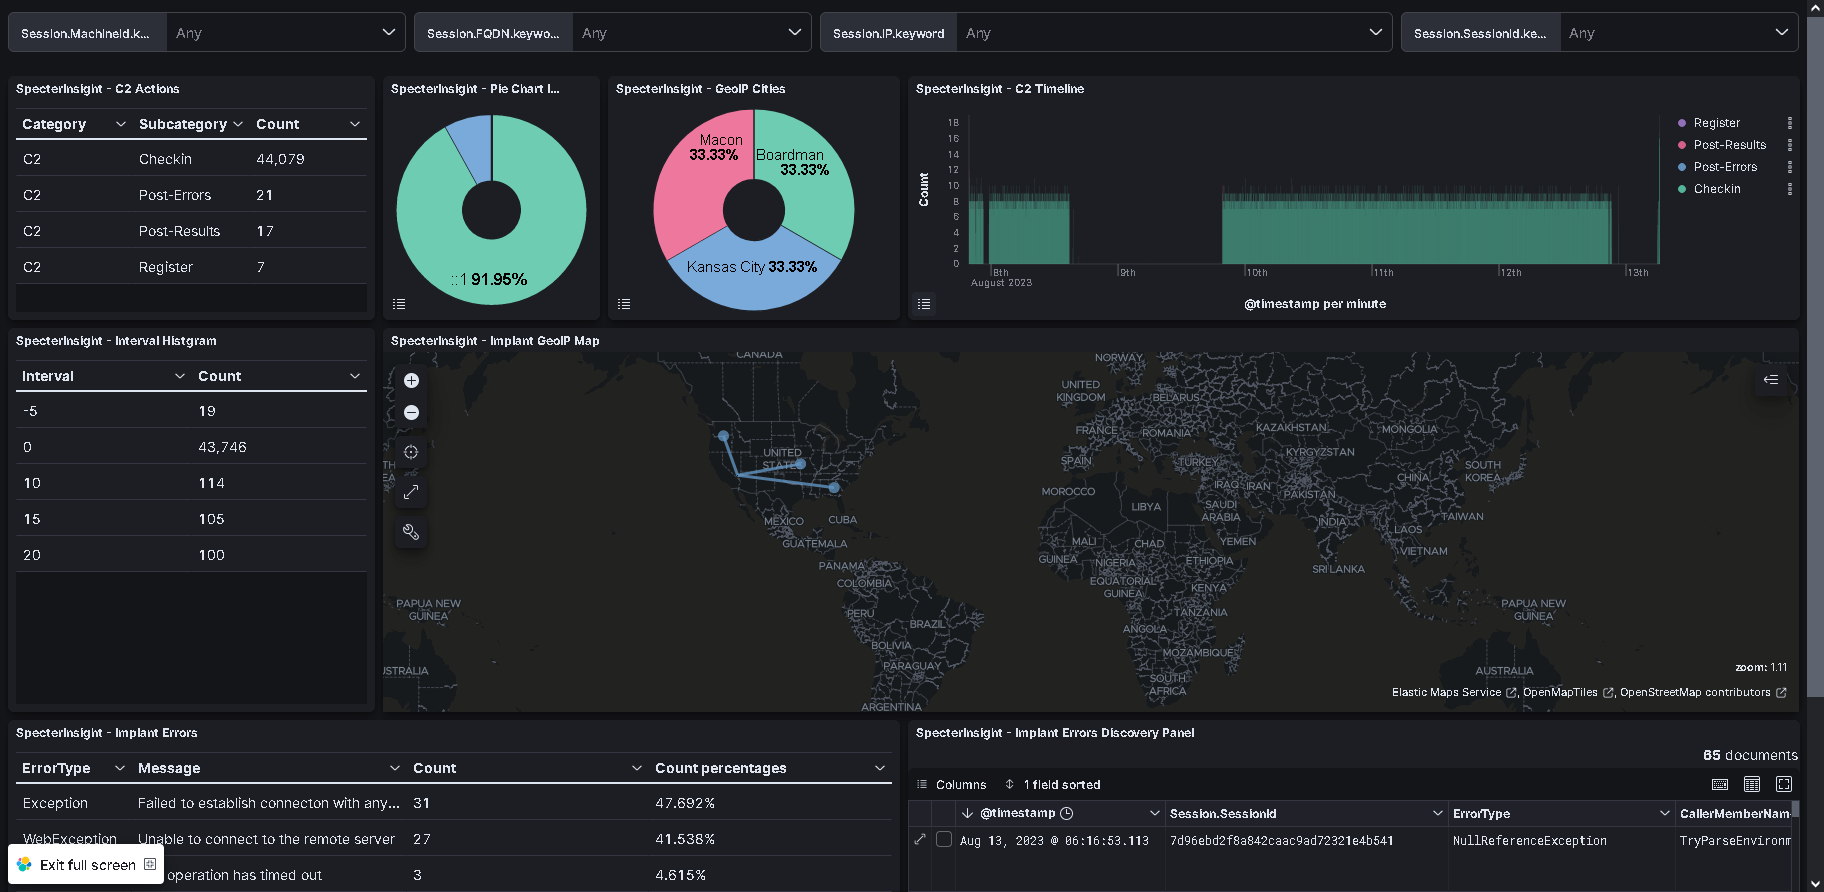
Infrastructure Dashboard
This dashboard gives you insight to infrastructure and callbacks from your specters. Specific event categories are identified such as register, check-in, post-errors, and post-results. All IP fields are automatically augmented with GeoIP data that gives lat/lon coordinates, city, country, and timezone information. This is then referenced to visualize callbacks on a global map, so you can clearly see where your callbacks are coming from.
The specter implant also catches and reports detailed errors to the C2 server. If anything goes wrong in the internals of the implant, the exception will be caught and reported, but the implant will continue to function. This dashboard will summarize the errors across all of the deployed specters.
Network Discovery Dashboard

The Network Discovery dashboard summarizes networked devices from command output from deployed specters. Nearly this entire dashboard can be populated from passive enumeration techniques such as interfaces, ARP table, and TCP connections but can also be populated using active techniques like TCP scanning.